Histogram
A histogram is a graphical representation of the distribution of a continuous variable.
The histogram is only an estimation of the distribution. To construct a histogram you have to bin
the range of values from the variable in a sequence of equal length
intervals, and later on counting the values from each bin. Histograms
can display counts, or can display proportions which are counts divided
by the total number of values.
Because the histogram uses bins that the
main parameter of a histogram is the bin width. The bin's width is
computed. To compute the width of a bin we need the number of bins and
the minimum and maximum from the range of values. The range of values
can be computed automatically from data or it can be specified when the
histogram is built.
Also, the number of bins can be omitted, in
which case this number is estimated also from data. For estimation is
used the Freedman-Diaconis rule (see Freedman-Diaconis wikipedia page) for more details.
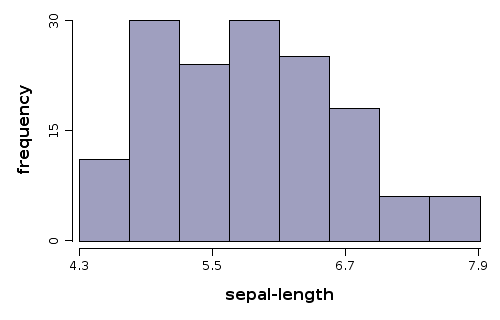
Example 1
Scope: Build a histogram with default values to estimate the pdf of
sepal-length variable from iris data set.
Solution:
WS.draw(hist(iris.var("sepal-length")));
Example 2
Scope: Build two overlapped histograms with default values to estimate the pdf of
sepal-length and petal-length variables from iris data set. We want to get bins in range (0-10) of width 0.25, colored with red, and blue, with a big transparency for visibility
Solution:
WS.draw(plot(alpha(0.3f))
    .hist(iris.var("sepal-length"), 0, 10, bins(40), color(1))
    .hist(iris.var("petal-length"), 0, 10, bins(40), color(2))
    .legend(7, 20, labels("sepal-length", "petal-length"), color(1, 2))
    .xLab("variable"));
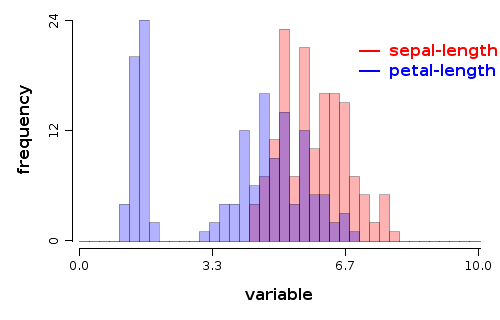
plot(alpha(0.3f))- builds an empty plot; this is used only to pass default values for alpha for all plot components, otherwise the plot construct would not be neededhist- adds a histogram to the current plotiris.var("sepal-length")- variable used to build histogram0, 10- specifies the range used to compute binsbins(40)- specifies the number of bins for histogramcolor(1)- specifies the color to draw the histogram, which is the color indexed with 1 in color palette (in this case is red)legend(7, 20, ...)- draws a legend at the specified coordinates, values are in the units specified by datalabels(..)- specifies labels for legendcolor(1, 2)- specifies color for legendxLab= specifies label text for horizontal axis